
A LiDAR point cloud is a three-dimensional digital representation of an environment. Each point corresponds to a measurement positioned in space and contributes to reconstructing the geometry of the terrain, vegetation, buildings, or infrastructure.
Beyond 3D visualization, a point cloud is measurable geospatial data. It can be used to determine elevations, generate terrain models, calculate volumes, and analyze the structure of an environment.
The number of points matters, but it is not enough to determine the quality of a survey. Their distribution, accuracy, classification, and position relative to the surfaces of interest are just as important.
What is a LiDAR point cloud?
A LiDAR system emits laser pulses and measures their travel time after they interact with a surface. By combining the measured distance with the position and orientation of the system, the three-dimensional coordinates of each measurement can be calculated.
In a LiDAR file, a point has X, Y, and Z coordinates. Depending on the data format and acquisition system, it may also contain signal intensity, return number, classification, and color values.
This information can then be used to distinguish, for example, points corresponding to the ground, vegetation, or specific structures.
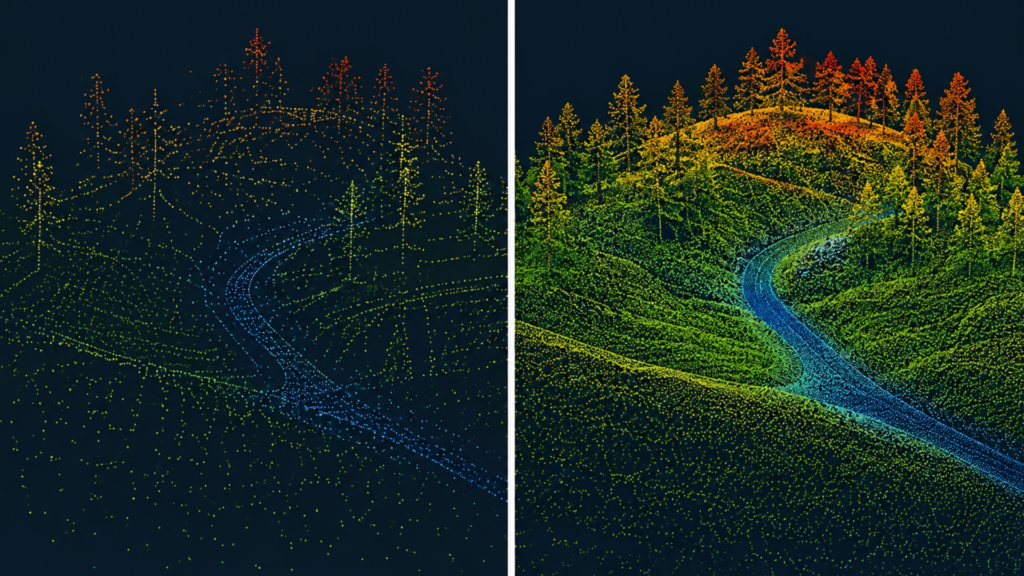
How to interpret a point cloud
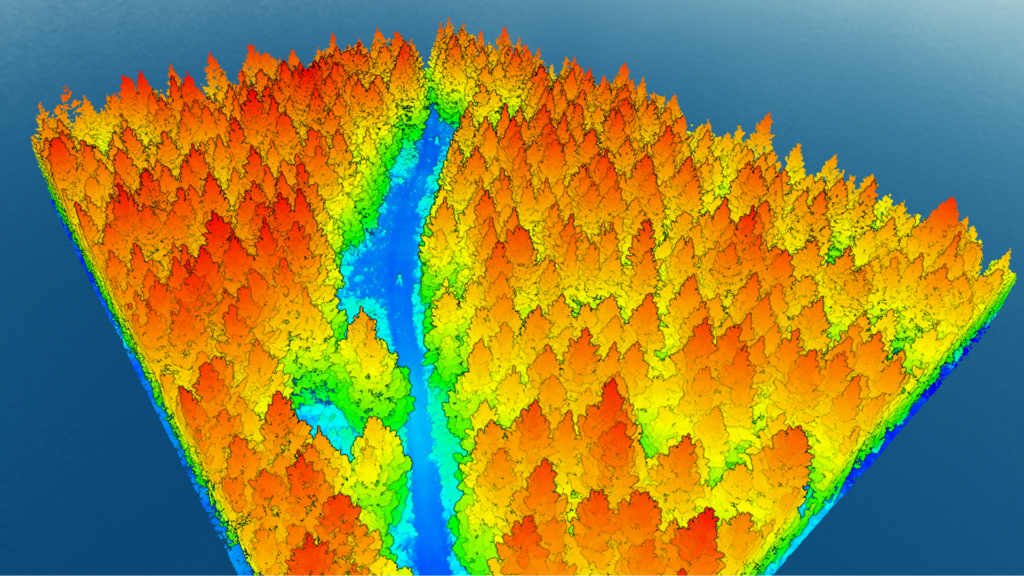
Geometry is the first level of interpretation. Coloring points according to elevation makes it possible to quickly visualize the terrain and distinguish objects located above the ground.
Intensity provides complementary information. It represents the magnitude of the signal returned to the sensor. Its value depends on the system being used as well as the measurement conditions. It should therefore not be interpreted as a universal reflectance value that can be directly compared across all LiDAR surveys.
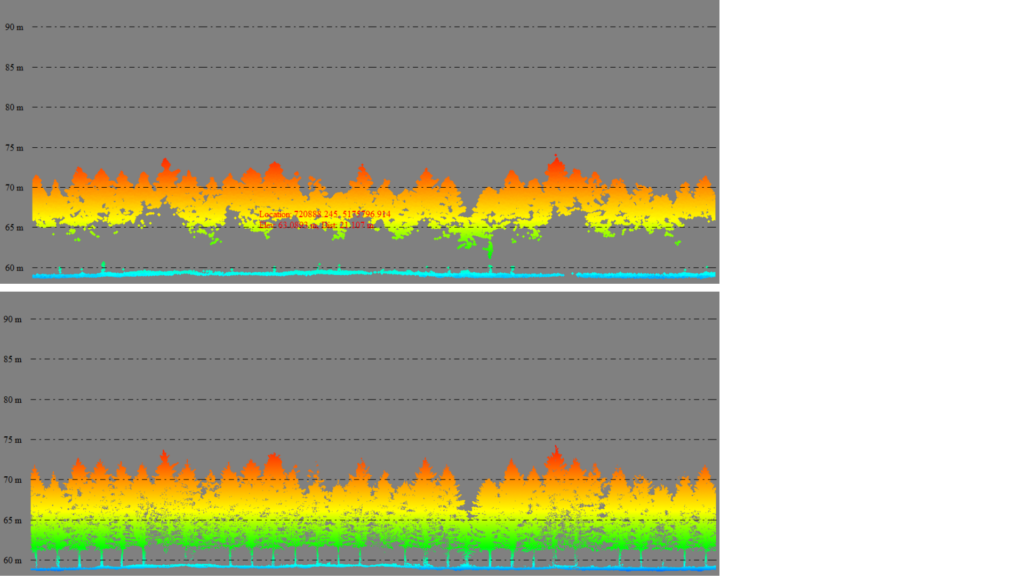
Laser returns provide another layer of information. A single pulse can generate multiple returns when its energy encounters different elements along its path. In a forest environment, measurements may therefore come from the canopy, intermediate branches, and the ground.
This multiple-return capability helps describe the vertical structure of vegetation and obtain measurements beneath the canopy when enough energy reaches the ground.
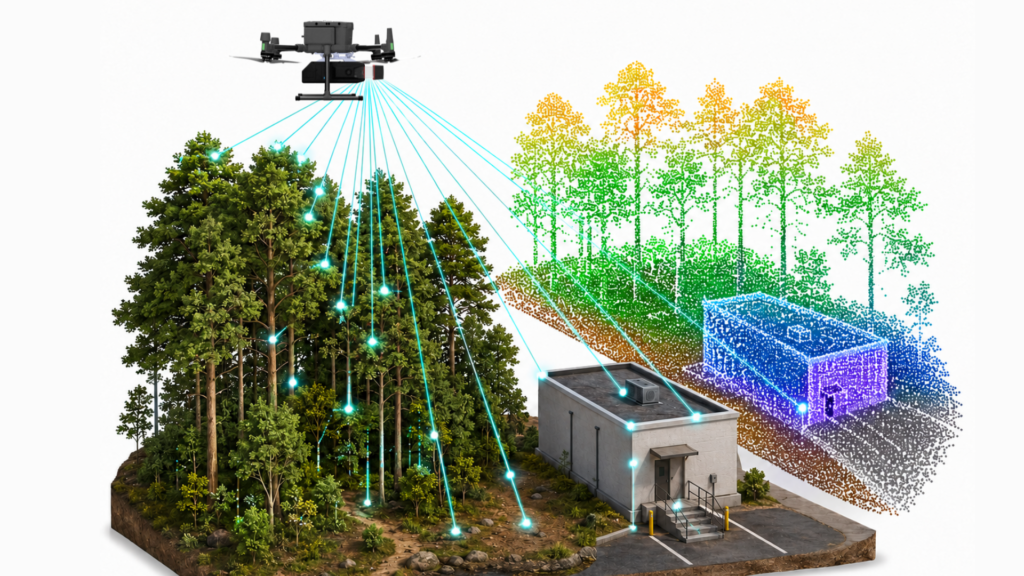
Understanding LiDAR point cloud density
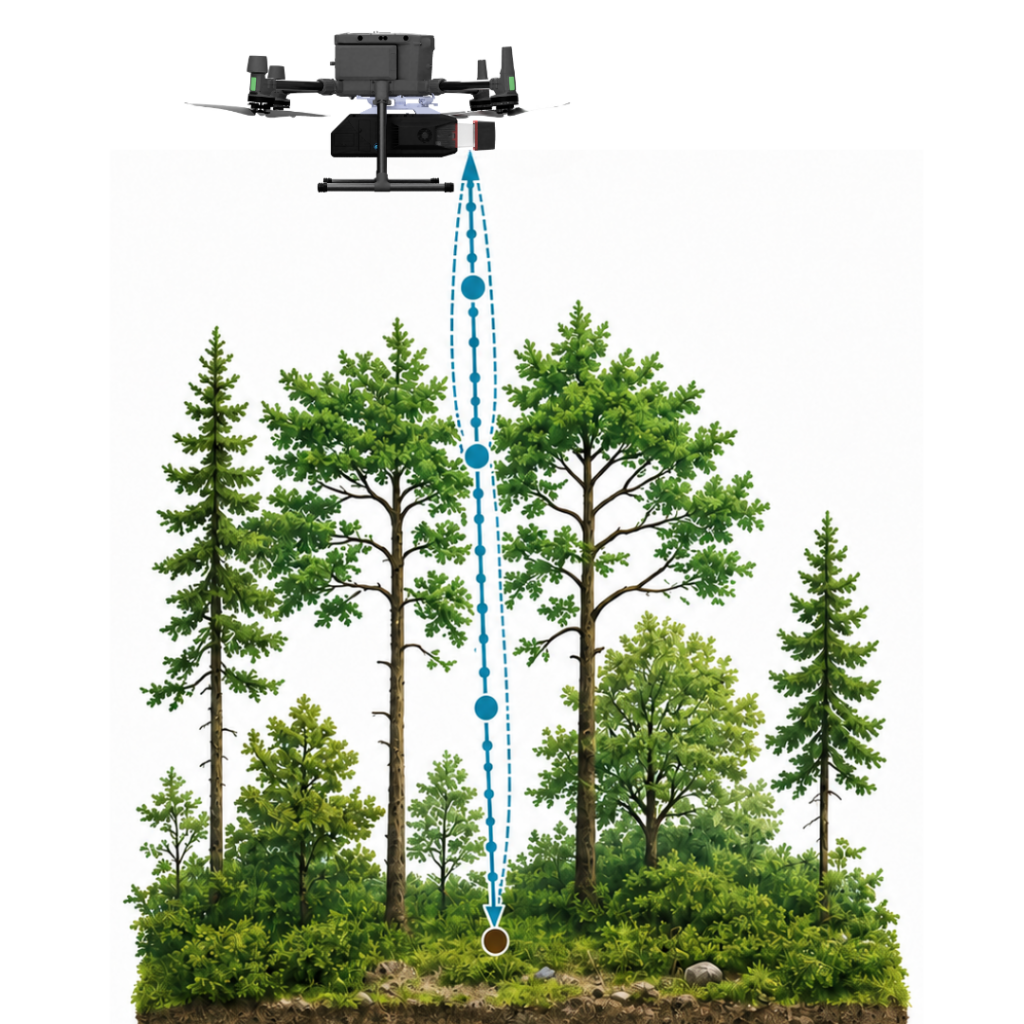
Density is generally expressed in points per square metre. It describes the number of measurements available over a given surface area.
It is important, however, to distinguish point density from pulse density. A single pulse can generate several returns and therefore several points. Counting all returns will consequently produce a different value from the number of individual pulses that actually sampled the surface.
This distinction matters when comparing two datasets. Different methods of calculating density can produce significantly different results. It is therefore recommended to specify the method used to measure and report density.
Average density also does not fully describe point distribution. Two point clouds containing 100 points/m² can provide very different sampling quality if one is relatively uniform while the other contains clusters of points and poorly covered areas.
Point density and spacing
One simple way to interpret density is to convert it into theoretical point spacing.
With a perfectly uniform distribution, 25 points/m² correspond to approximately 20 cm between points. At 100 points/m², the spacing decreases to approximately 10 cm.
This relationship is important because spacing decreases according to the square root of density. Significantly increasing the number of points therefore produces progressively smaller gains in horizontal sampling.
It is preferable, however, to refer to theoretical spacing rather than resolution. The ability to distinguish an object also depends on its shape and orientation, scan geometry, laser footprint size, and the actual distribution of measurements.
What influences point cloud density
The density obtained on the ground depends on the sensor, but also on how the survey is carried out.
Flight altitude and speed have a direct effect on sampling. With comparable scan parameters, increasing altitude or speed tends to reduce the number of pulses per unit of surface area.
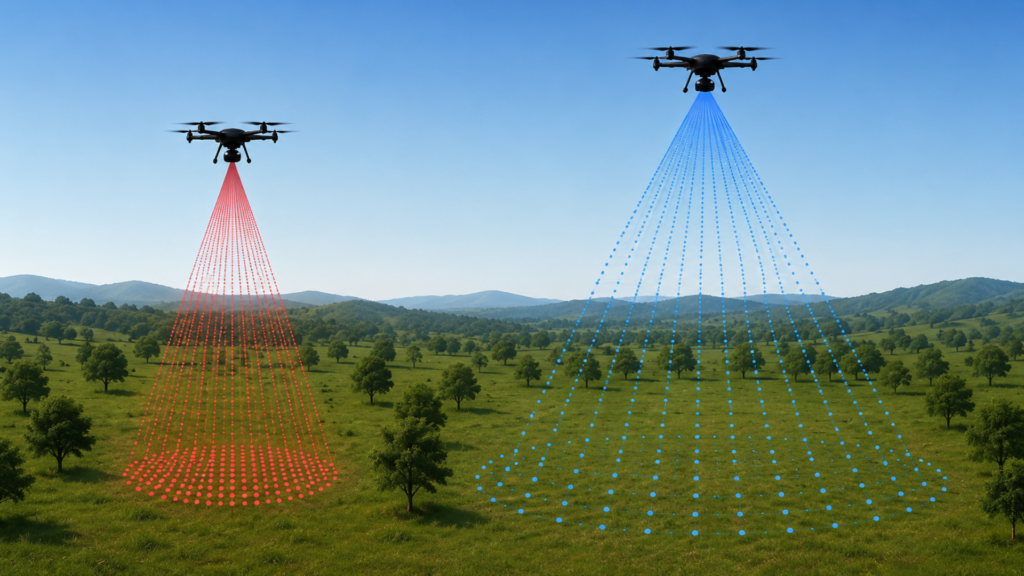
Pulse frequency, scan frequency, and field of view also influence point distribution. The result should not be reduced to the number of measurements per second advertised for a sensor. Swath width, trajectory, and the geometry of the scanning mechanism determine where those measurements are actually placed.
Overlap between flight lines can increase overall density and make it possible to observe certain surfaces from different angles. This variety of viewing geometries can be useful in complex environments. However, aggregate density should be distinguished from the density obtained within a single flight strip.
Finally, terrain and objects within the scene strongly affect useful density. Buildings create shadowed areas, while vegetation intercepts some of the laser pulses. Studies of airborne LiDAR point clouds show that points classified as ground are generally fewer and more irregularly distributed in vegetated areas than in open environments.
Total density and ground point density are not the same
This distinction becomes particularly important in forest environments.
A survey can contain a very large number of points within the canopy while providing relatively few points on the ground. Branches and foliage intercept part of the laser energy before it reaches the terrain, making the distribution of returns more irregular.
Increasing the acquisition frequency may improve the chances of obtaining additional measurements, but the gains are not necessarily proportional. In some cases, the additional pulses mainly encounter vegetation rather than new openings through which the ground can be reached.
When producing a digital terrain model beneath a canopy, it is therefore more relevant to evaluate the number and distribution of ground points than the total number of points in the cloud.
This reflects a best practice used at Balko: define the data that is actually required before optimizing the mission. High density in the wrong areas of the scene does not necessarily improve the final deliverable.
How much density is required?
There is no universal value.
Required density depends first on the objective of the survey. A general topographic model does not necessarily require the same level of sampling as a detailed analysis of infrastructure or vegetation.
Public specifications can provide useful benchmarks. For example, the Federal Airborne LiDAR Data Acquisition Guideline, published by Natural Resources Canada and Public Safety Canada, establishes quality levels and common practices for projects carried out across the country. It also emphasizes that acquisition requirements should be adapted to the project, terrain type, and intended use of the data, including forestry, flood mapping, and urban applications.
Density should therefore be defined according to the need rather than the maximum capability of the sensor.
What can be measured with a point cloud?
After georeferencing, quality control, and classification, a point cloud can be used to generate a digital terrain model, analyze slopes, or calculate volumes.
In forestry, the vertical distribution of returns can be used to study vegetation height and structure, while points reaching the ground can be used to reconstruct terrain beneath the canopy.
For infrastructure, acquisition geometry becomes particularly important. Building façades, poles, and other vertical surfaces are better represented when they are observed from appropriate angles.
Plan density based on the deliverable
A good practice is to start with the desired result: a terrain model, volume calculation, forest inventory, infrastructure inspection, or another geospatial product.
From there, it becomes possible to determine the required level of detail and identify the surfaces that actually need to be sampled. The choice of LiDAR, altitude, speed, overlap, and acquisition parameters can then be adapted to that objective.
This approach avoids maximizing the amount of data without producing a measurable benefit. It also reduces the volume of data that must be transferred and processed while focusing the acquisition on the information that is actually useful.
Key takeaway
Density is an essential indicator for understanding a LiDAR point cloud, but it must always be considered in context.
Total density, pulse density, and ground point density can represent very different realities. Altitude, speed, scanning parameters, overlap, vegetation, and occlusions also influence the final distribution.
A successful LiDAR survey therefore does not simply aim to produce more points. It aims to obtain enough measurements, properly distributed and positioned on the surfaces required for the final deliverable.
Other news
Éducation
29 July 2026
Technological sovereignty
Discover why technological sovereignty influences the choice of geospatial solutions in...